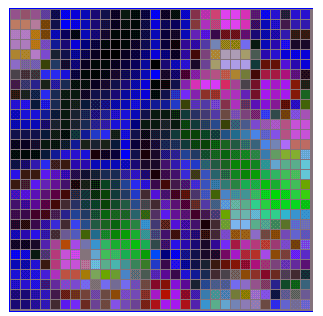

The figure on which you have clicked, shown in enlarged form to the right, was generated by a self-organising map, and illustrates the data clustering which such maps accomplish.
A full description of the way in which this figure was created was published in The Chemical Educator, 2000, 5, 196-206. Supporting material and an abstract are available. Contact Hugh.Cartwright@chem.ox.ac.uk if you'd like an electronic or hardcopy version of the paper.
Return to
Hugh Cartwright's Home Page.
Updated January 30, 2001